
From Failed Interview to Functional Tool: My First Media Mix Model

I recently interviewed for a small-to-medium size company that was hiring a marketing scientist. I didn’t get a call back, but I found the role interesting.
The idea was to apply statistics to marketing spend to understand the return on sales. Later, I realized what they were really after — and in this economy, I totally get it: Media Mix Modelling.
So, What is Media Mix Modelling?
Media Mix Modelling (MMM) uses statistics to estimate the impact of different marketing channels—Search, Social, Display, Email, Influencers, TV, Print, etc.—on sales.
It helps teams answer two big questions:
Which channels are truly driving sales lift?
What’s the best mix for the next campaign?
In other words, it’s figuring out where to put your hard-earned dollars to get the best bang for your buck.
My Approach
Since I was brand new to this, here’s how I tackled the project step by step:
Learned the basics — I used AI to surface articles and resources so I could wrap my head around MMM.
Studied methodologies — I focused on concepts like adstock, regression, and modern MMM techniques.
Created data — Because real MMM data is proprietary, I simulated my own. This gave me control and flexibility while learning.
Built the model — I applied adstock to capture the lingering effects of marketing, then ran OLS regression to estimate baseline sales and channel coefficients.
Made it usable — I built an interactive Power BI dashboard so a marketing team could explore channel compositions and immediately see the impact of budget changes.
The Data
I simulated 2 years of weekly spend and sales data for a fictional brand, using a 445 calendar (13-week quarters). Alongside media spend, I added features like promotions, seasonality, and brand mentions. My plan is to use these in a Part 2 where I explore Marketing Mix Modelling (MMM’s bigger sibling) and long-term brand effects.
Example columns:
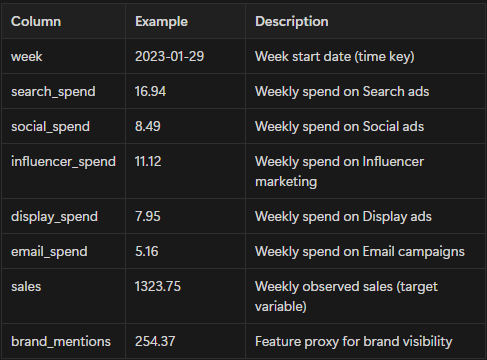
I also included variables like weather, holidays, and inventory — because in reality, sales aren’t driven by media alone.
The Modelling
Adstock
The first step was applying Adstock.
Here’s how I understood it: let’s say you spend $100 on display ads during the week. A customer might see those ads on Sunday — and still remember them the next week. That memory decays, though. So we apply a constant (say 50%) to indicate how much of last week’s effect carries over.
For example, with $100 weekly spend and a 50% decay:
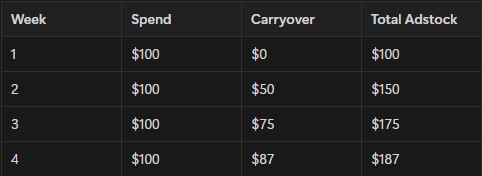
Eventually, this levels off — no extra lift unless you increase spend.
If you’re curious, I’ve shared a Python script in my GitHub portfolio called Adstock_Playground where you can see it in action.
OLS Regression
Once the adstock was applied, I ran an Ordinary Least Squares regression.
This estimates two key things:
Baseline sales (β0) — sales without any marketing spend.
Coefficients (β1, β2, …) — how much each channel contributes to sales per unit of adstock spend.
Equation:
y = β0 + β1x1 + β2x2 + … + ϵWhere:
y = sales
β0 = baseline sales
β1x1 = contribution from channel 1
ϵ = unexplained factors (holidays, weather, etc.)
In simple terms:
Baseline sales = what sales would be at zero spend.
Coefficients = how sales move when adstock spend increases.
We need these numbers to plug into the predictive equation.
An Example
Suppose regression gave us:
Baseline sales (β0) = 2,174.66
Search coefficient (β1) = 0.02
Social coefficient (β2) = 0.04
For one week:
Search adstock spend = 1,600
Social adstock spend = 1,500
Prediction:
y^ = β0 + β1⋅Search_adstock + β2⋅Social_adstock
y^ = 2174.66 + (0.02*1600) + (0.04*1500)
y^ = 2,266.66
That’s the predicted sales.
Now, increase Social by 20% (1500 * 1.2 = 1,800):
y^ = 2174.66 + (0.02*1600) + (0.04*1800)
y^ = 2,278.66

2278.66 - 2266.66 = 12
That extra ~$12 lift is the impact of reallocating budget.
So while I used a predictive equation, the focus here was on experimenting with inputs and seeing the effect — not on forecasting future sales.
Power BI Dashboard
After running the numbers, I plugged everything into Power BI to make it practical.
The tool lets a user:
Input their total budget.
Adjust how much of that budget is spent across digital channels.
Instantly compare actual spend vs. scenario spend and see the predicted lift.
Instead of a static report, marketers now have a planning tool built from historical data.
Final Thoughts
This project started from a failed interview, but following my curiosity led me into a whole new space.
I leaned on AI heavily — not to “do it for me,” but to explain concepts again and again until I could explain them back in my own words. That’s the only way I can learn.
This project stretched me, and it left me excited to keep exploring new methods and ideas.
If you’re a marketer or an analyst, I’d love to know:
Would this tool help you understand your digital channels?
Would it help you plan your next campaign?
Check out my dashboard on GitHub — and let me know what you think.
References:
Media mix modeling (MMM): The complete guide for 2025. (2025). Invoca. https://www.invoca.com/blog/media-mix-modeling
Van Mossevelde, C. (2024). Multiple regression (MMM analysis) explained for marketers. Funnel. https://funnel.io/blog/what-is-multiple-linear-regression
Lundberg, C. (2023, October 26). Marketing Mix Modelling implementation | A real MMM case study from an expert data analyst [Video]. YouTube.
Billington, A. (2024). What is marketing mix modeling (MMM) explained. Funnel. https://funnel.io/blog/what-is-marketing-mix-modeling-mmm-explained
Further Reading:
Meta Marketing Science. (n.d.). Robyn: A new generation of marketing mix modeling. https://facebookexperimental.github.io/Robyn/
Let’s Connect
Thanks for reading! If you enjoyed this breakdown, subscribe below to get future posts (I’ve got more tools and experiments coming).
I’d also love to hear from you — if you’re in marketing, would you use a tool like this? Or if you’re learning data like me, does this make MMM feel less scary? Drop your thoughts in the comments.